
Property Investment
What properties are Opes recommending right now?
Curious what properties Opes Partners recommends? See real examples, prices, and locations of the investment properties we're recommending right now—updated weekly.
Property Investment
2 min read
The property market is changing. But not how you think.
Property prices are up just 2.6% since the bottom of the market. That’s for the whole country.
But that national average masks the two-tier recovery going on.
Scratch the surface, and there are some places that are going down in value. Other areas are quietly recovering.
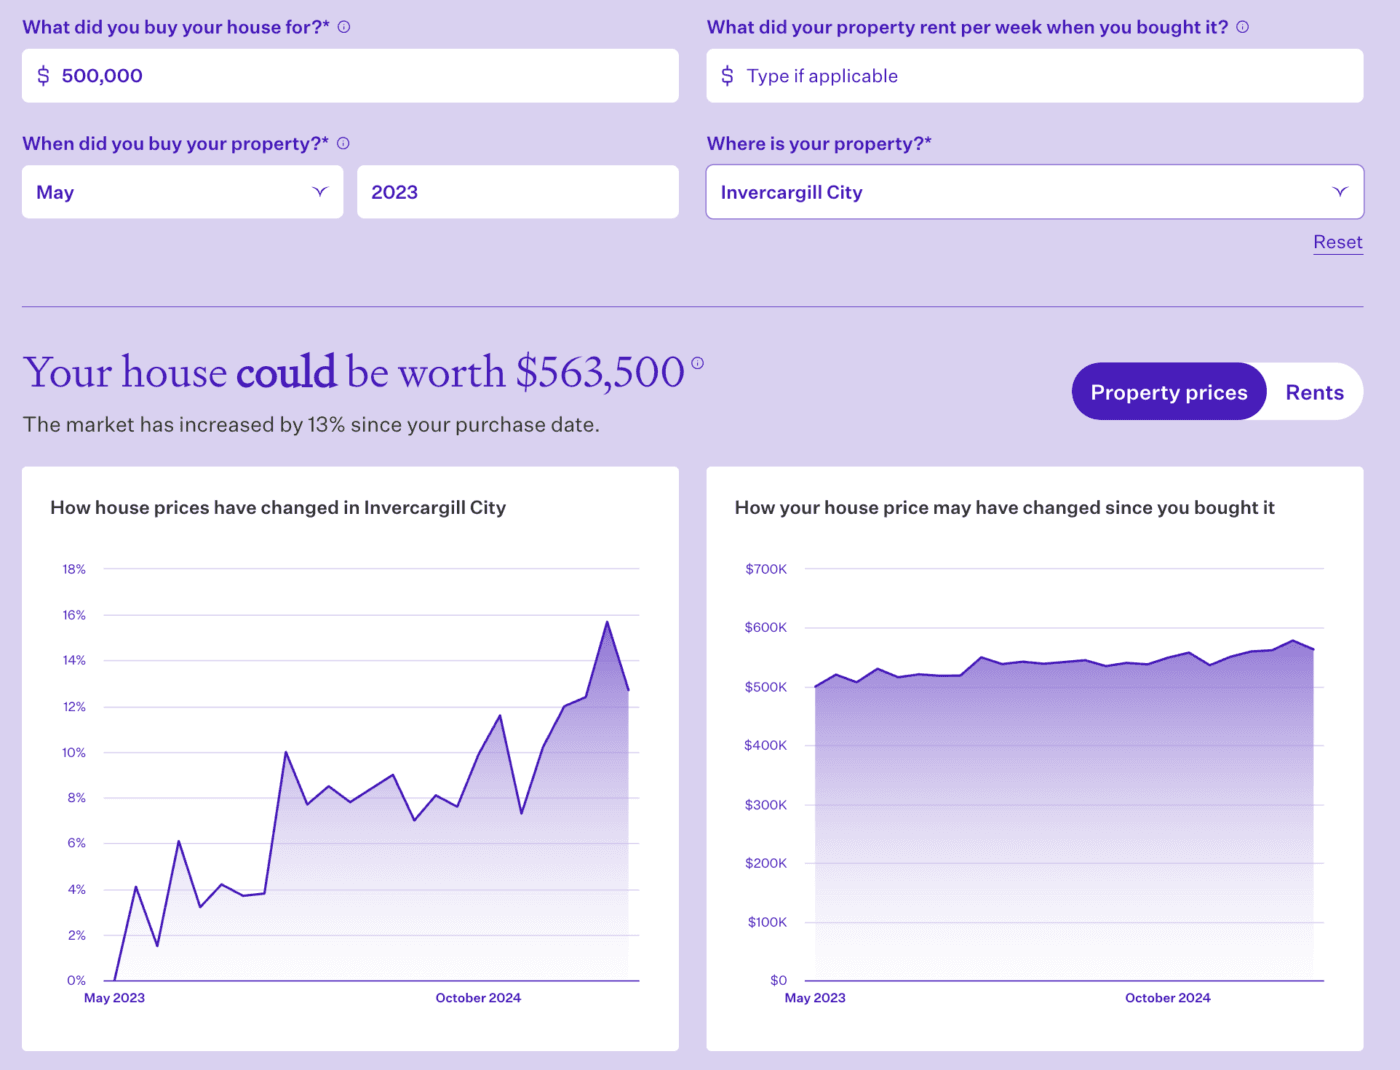
Invercargill City house prices bottomed out in May 2023. Same as the rest of the country.
But, since then house prices are up 13%.
If you timed the market perfectly and bought a $500k property, it could be worth $563,500.
Queenstown’s up 11% since the end of 2022. Dunedin is up almost 8% since its bottom of the market. Christchurch is up 7.3%.
So, national property prices are flat. But they’re not flat everywhere.
Looking at just the last 12 months:
Think of it like GDP
Over the last year, GDP went down 1.1%. The economy got smaller.
Does that mean every business took a 1.1% hit in revenue?
Nope, some industries and businesses are growing. Some businesses and industries are shrinking.
Just like GDP is an average of lots of sectors, the national house price is just an average of lots of markets.
Nationally, property prices are just 0.1% higher today than they were a year ago. Practically no change.
But house prices are up in some areas and down in others.
It averages out to zero. But that national average doesn’t tell you what’s happening across the whole nation.
That’s the 2-tier recovery in action.
If you’re investing, look beyond the averages to find the opportunities.
Over the last 12 months New Zealand property prices are up 0.1%. That includes a 0.6% decrease in May.
In May it took 47 days to sell a property (on average). That's 3 days more than the same time last year.
Currently there are 32,884 properties on the market. That is up 5.5% compared to last May.
In terms of sales, May was much stronger than the previous year. 7,166 properties sold last month. That's 10.9% up on the prior year.
Rents are the same. No change year-on-year. It’s still $600 a week.
A lot of you also asked for the average rent broken down by property type and number of bedrooms.
The average rent for a:
The number of rental searches on TradeMe was up 1% last month compared to the same time last year.
The number of listings were up 9% compared to the same time last year.
So demand flat, supply up a bit. That’s why those advertised rents are a bit softer.
Want to see all the latest stats about the New Zealand property market? Here is my full update.

Resident Economist, with a GradDipEcon and over five years at Opes Partners, is a trusted contributor to NZ Property Investor, Informed Investor, Stuff, Business Desk, and OneRoof.
Ed, our Resident Economist, is equipped with a GradDipEcon, a GradCertStratMgmt, BMus, and over five years of experience as Opes Partners' economist. His expertise in economics has led him to contribute articles to reputable publications like NZ Property Investor, Informed Investor, OneRoof, Stuff, and Business Desk. You might have also seen him share his insights on television programs such as The Project and Breakfast.
This article is for your general information. It’s not financial advice. See here for details about our Financial Advice Provider Disclosure. So Opes isn’t telling you what to do with your own money.
We’ve made every effort to make sure the information is accurate. But we occasionally get the odd fact wrong. Make sure you do your own research or talk to a financial adviser before making any investment decisions.
You might like to use us or another financial adviser


