The Reshuffle of Returns
Click 'present' to see how annual property returns reshuffle year-to-year
Property Market
2 min read


Author: Stevie Waring
Financial Adviser with 7 years of experience. Property investor in Wellington and Christchurch
Reviewed by: Ben King
Ben has 14 years of experience as a mortgage advisor and background as an investment adviser.
Which cities are home to the highest property investment returns?
In this article, you’ll see how property has performed across New Zealand's main markets over different timeframes.
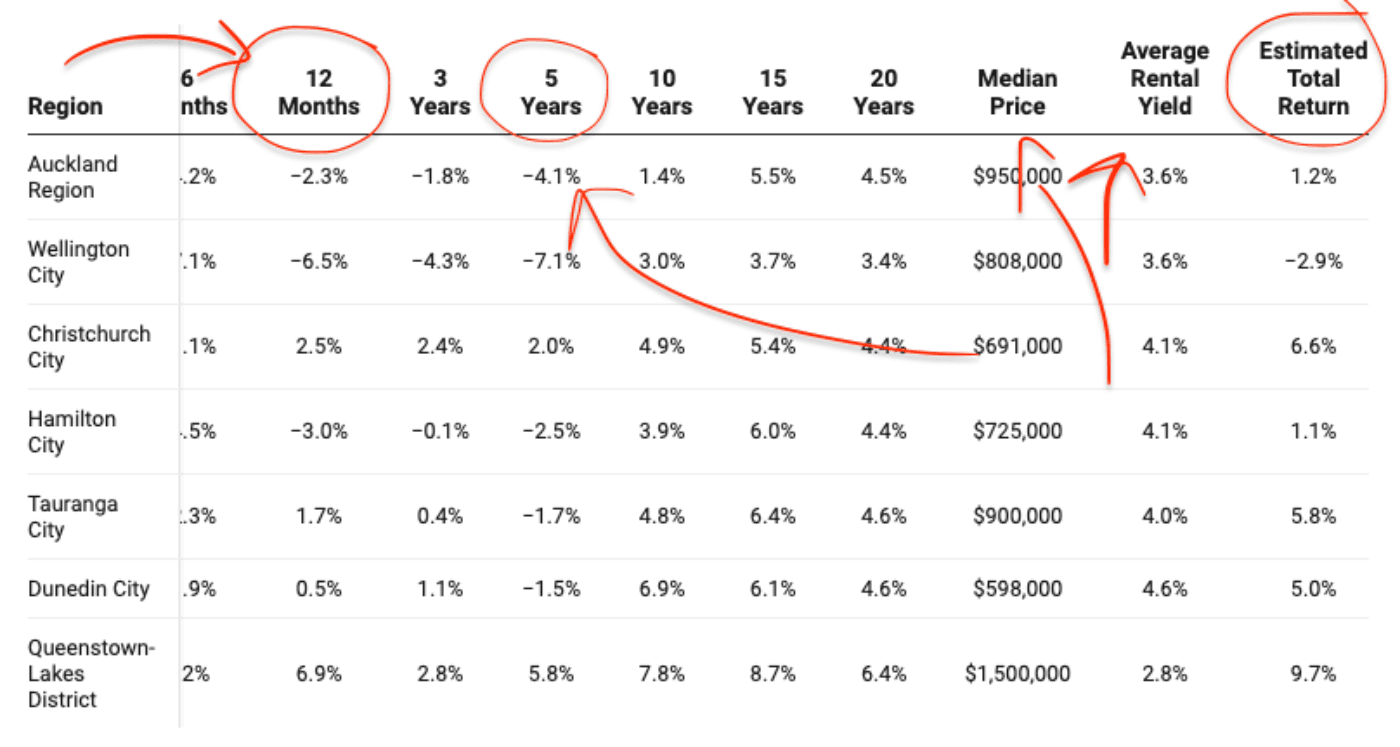
The 1-year column tells you how much house prices have changed over the last year.
The longer-term figures show the average annual change over that period.
Then, on the right-hand side, we've added the estimated rental return.
Let's work through it.
Let's start with the short term.
In the 12 months to August 2026, there was a massive difference in how New Zealand's main property markets had performed.
Christchurch City house prices were up 2.5%, and Queenstown-Lakes District house prices were up 6.9%.
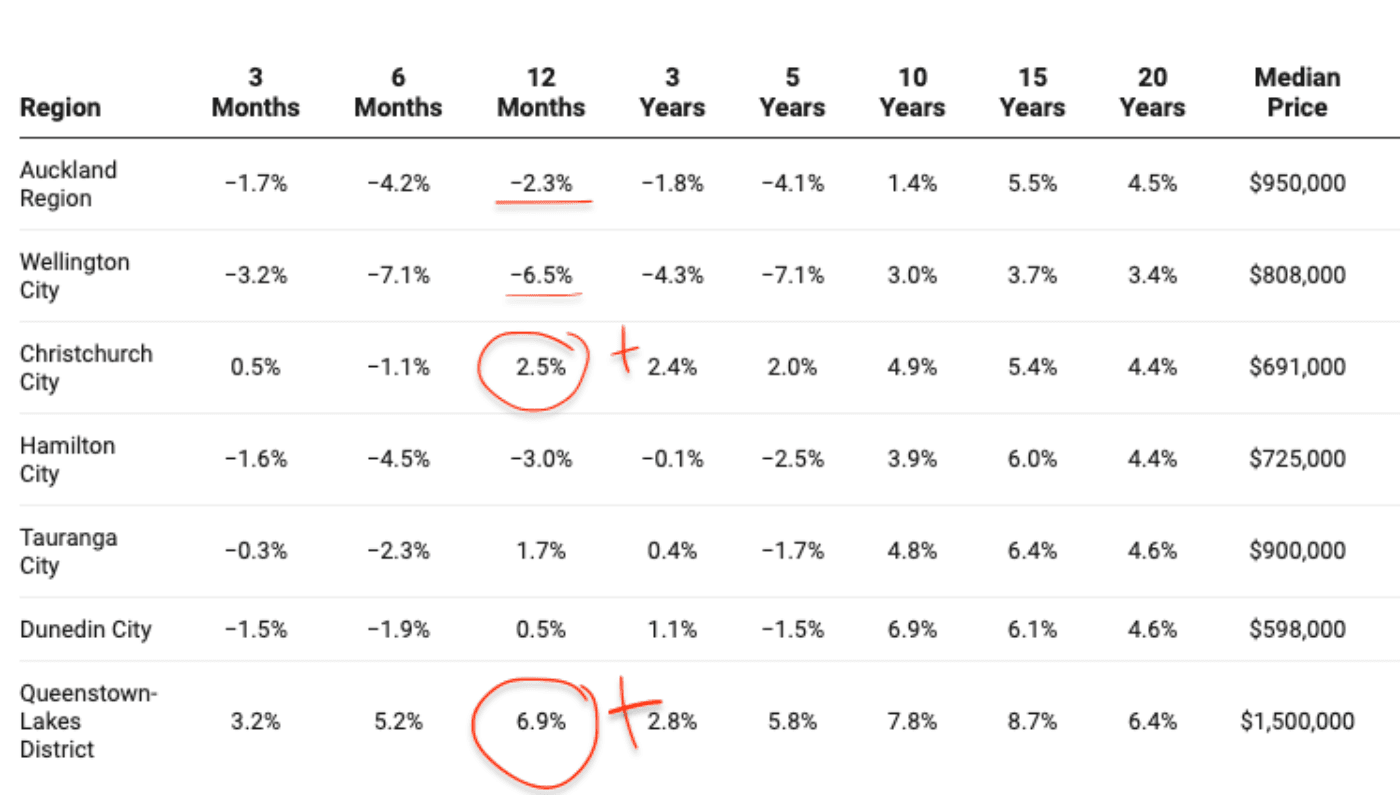
At the other end, Wellington house prices were down 6.5%, while Auckland is down 2.3%.
That's a spread of more than 13 percentage points between Queenstown-Lakes and Wellington.
So, when someone says “the property market is up (or down)” that doesn't necessarily tell you much about what's happening in your market.
This is why we also show returns over the prior 3, 5, 10, 15 and 20 year periods.
Now move your eyes across to the right-hand side of the original table.
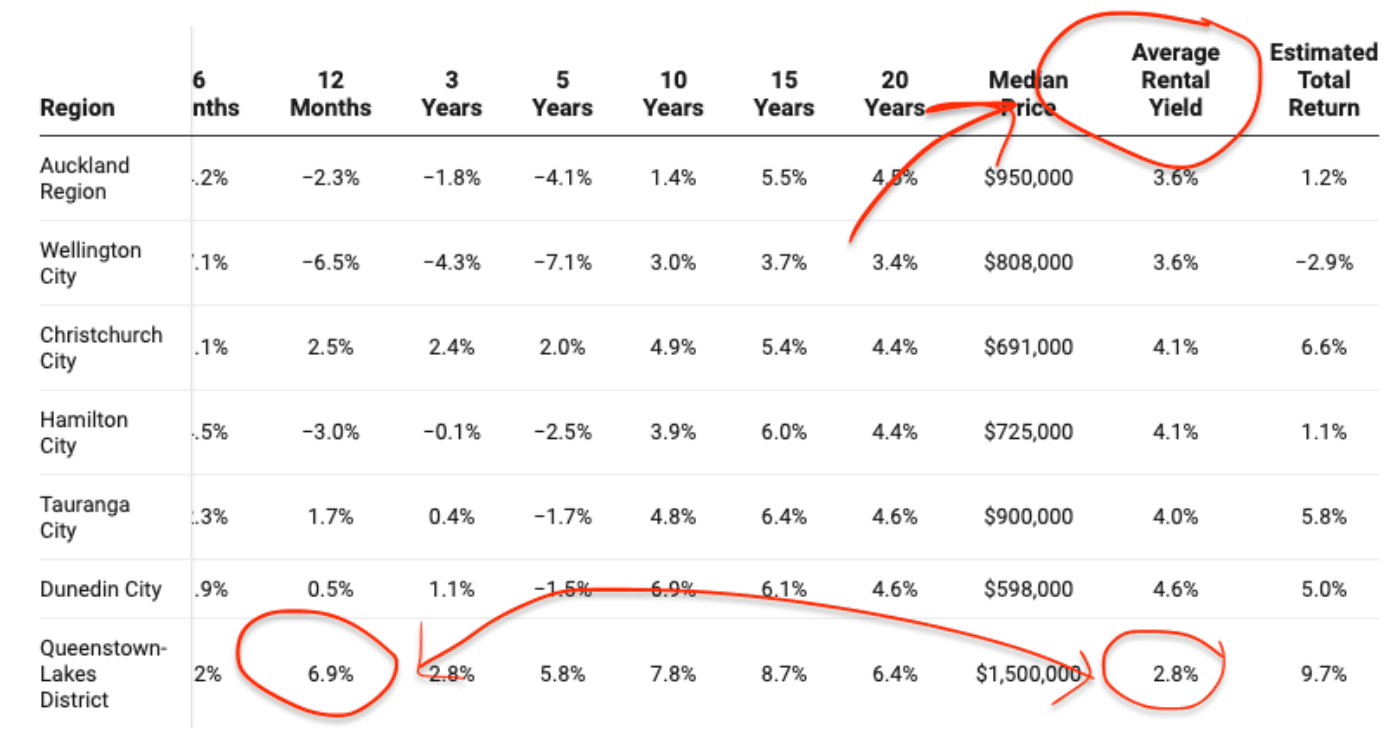
Because house price growth (capital growth) is only one part of an investor's return. The other is how much rent you make (rental income).
And again, the numbers vary significantly between markets.
Even though as at August 2026 Queenstown-Lakes had the highest house price increase … it also had the lowest rental yields at 2.8%.
Keep in mind that this excludes any costs like rates, maintenance, insurance and mortgage interest.
That's what the final column tries to show. And we've deliberately kept the calculation simple.
We take the 12-month change in house prices and add the estimated gross rental yield.
So, Queenstown-Lakes had 6.9% house-price growth + a 2.8% estimated rental yield = 9.7% estimated total return.
Keep in mind that not every Queenstown-Lakes investor will have made a 9.7% return. This should be seen as a broad estimate only. It’s more useful as a way of comparing the different regions, rather than benchmarking your own property.
This table isn't here so you can find the city with the highest return and simply buy there.
It's about putting property returns into context.
So you can compare different markets, different timeframes, and the balance between capital growth and rental yield.
Just remember, past returns aren't a forecast.
They tell you what happened, not what happens next.
Financial Adviser with 7 years of experience. Property investor in Wellington and Christchurch
Stevie Waring is a Financial Adviser with over 7 years of experience in property investment and a successful investor herself. Stevie has successfully guided over 200 Kiwis in their property investments, helping them move closer to achieving their financial goals.
This article is for your general information. It’s not financial advice. See here for details about our Financial Advice Provider Disclosure. So Opes isn’t telling you what to do with your own money.
We’ve made every effort to make sure the information is accurate. But we occasionally get the odd fact wrong. Make sure you do your own research or talk to a financial adviser before making any investment decisions.
You might like to use us or another financial adviser