Property Investment
Property Investment
2 min read

Author: Andrew Nicol
Managing Director, 20+ Years' Experience Investing In Property, Author & Host
Reviewed by: Ed McKnight
Resident Economist, with a GradDipEcon and over five years at Opes Partners, is a trusted contributor to NZ Property Investor, Informed Investor, Stuff, Business Desk, and OneRoof.
Private Property – our weekly newsletter that gives you insights into what's happening in the NZ property market. Written by managing director Andrew Nicol. Sign up to receive this in your inbox every Thursday.
House prices have declined. But, it’s not a crash. It’s a ‘correction,’ and a normal part of investing.
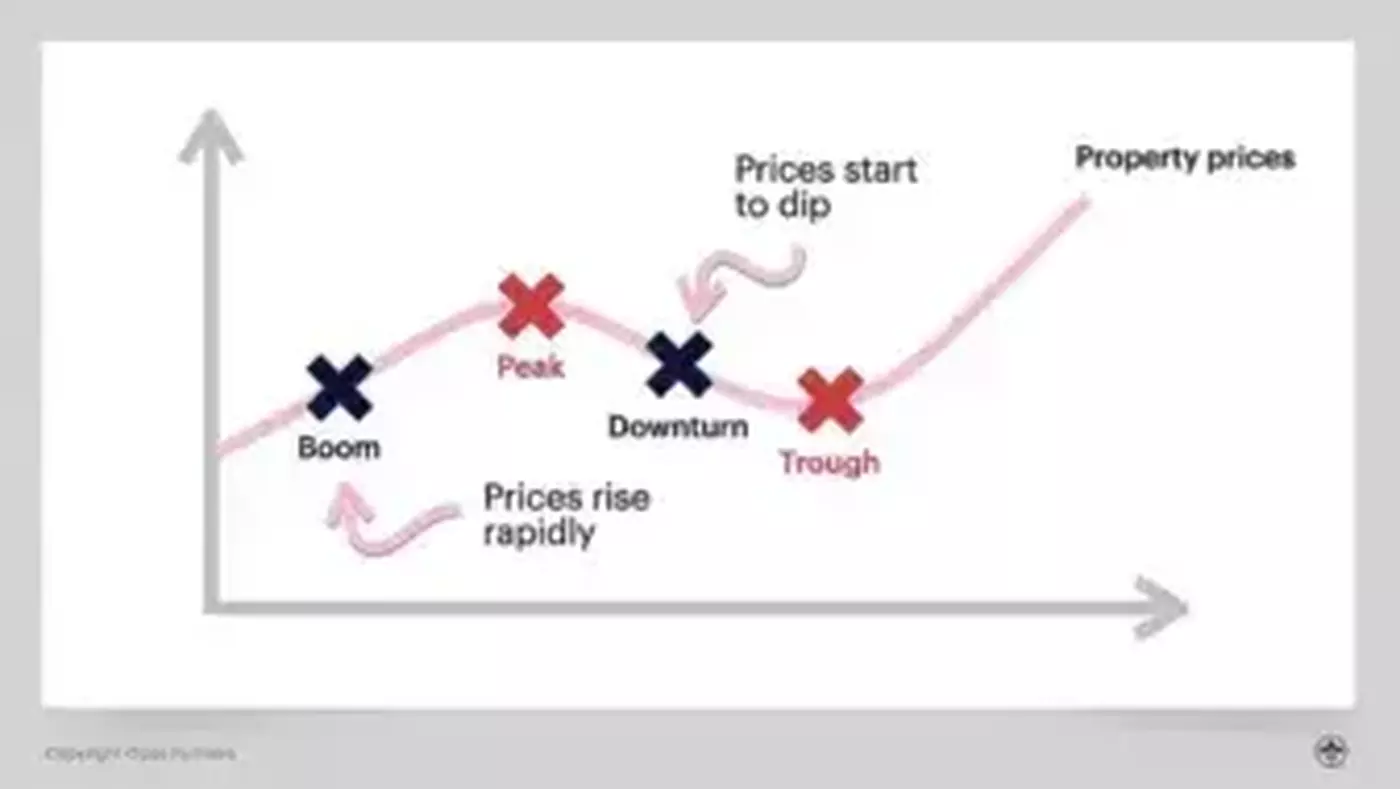
While the price of most stable assets (a.k.a property) tend to increase over the long-term, there are ups and downs throughout the journey. And prices tend to follow a cycle.

Here’s how the property cycle usually goes: There’s a boom period where investors feel confident and start buying (that’s the last 2 years in the NZ property market).
But eventually, prices peak and investors start to feel nervous (that happened late last year).
You then go through a downturn, sometimes caused by an external event. We’re in this period now, which was kick-started by the CCCFA, a law that tightened bank lending.
At some point prices tend to bottom out – that’s called a trough – before moving back into a boom period again.
The trouble when applying this thinking to property prices is that it’s really hard to identify each period of the cycle on a house price graph.
To show you what I mean, take a look at this graph of Wellington house prices.
The booms are easy to identify. But, even in retrospect, the downturns and troughs aren’t as obvious.
That’s why when investing, I combine the traditional ‘investment cycle’ model, with the ‘property cycle’ model (which I’ve borrowed from Economist, Tony Alexander).
Here’s an example of how these two models work together
Take a look at the below to see Wellington’s property cycle, which suggests whether an area is undervalued or overvalued.
See how it's much easier to identify the trends?
This graph is calculated by comparing Wellington house prices with New Zealand house prices.
When the line is going up, Wellington house prices are increasing faster than the rest of New Zealand.
When the line is going down, Wellington house prices are increasing more slowly (or declining more quickly) compared to the rest of the country.
While not a perfect replacement for the 'investment cycle' model. Taken together, they give a good indication of whether it's an opportune time to invest in a specific region.
Right now, the Wellington region appears to be 7.6% overvalued. From the graph, you can see the region is passed its peak. So, there are probably buying opportunities elsewhere in New Zealand.
Why is this thinking important in today’s market?
Prices won’t fall by the same amount everywhere.
One region might see prices dip by 5%, while another cops it by 15%.
Similarly, some regions will see their house prices increase more quickly after the dip than others. After the last property price dip in 2008, Auckland prices fully recovered in 3.67 years, while Gisborne took 11 years.
And if you want to dig deeper, you can find the data for each region on the Opes website.
Managing Director, 20+ Years' Experience Investing In Property, Author & Host
Andrew Nicol, Managing Director at Opes Partners, is a seasoned financial adviser and property investment expert with 20+ years of experience. With 40 investment properties, he hosts the Property Academy Podcast, co-authored 'Wealth Plan' with Ed Mcknight, and has helped 1,894 Kiwis achieve financial security through property investment.
This article is for your general information. It’s not financial advice. See here for details about our Financial Advice Provider Disclosure. So Opes isn’t telling you what to do with your own money.
We’ve made every effort to make sure the information is accurate. But we occasionally get the odd fact wrong. Make sure you do your own research or talk to a financial adviser before making any investment decisions.
You might like to use us or another financial adviser