Property Investment
What’s the chance I lose money through property?
Wondering about the risks of property investment? Find out the chances of losing money and what factors can impact your property investment returns.
Property Investment
8 min read

Nerd alert: This is a technical article, but it’s worth reading because this is how we make sure your financial plan is robust.
Many financial plans aren’t that robust.
That’s because when you create a financial plan, you’ll run lots of numbers and make a lot of assumptions.
You might invest in property and assume it rises in value by 5% a year. Or you might invest in an aggressive managed fund and assume it goes up in value by 7% a year.
But what if houses don’t go up in value by 5% a year? What if your shares don’t jump in value by 7% a year?
That’s called market risk, and in the past it’s been difficult to get your head around and understand that risk.
That’s the exact reason why, here at Opes, we use advanced financial modelling – a Monte Carlo Simulation.
This helps you think about risk … and means your plan is more robust. In this article you’ll learn what it is and how it works.
As plainly as possible, it’s a mathematical technique. And we use it to estimate the probability that something happens … in this case the chance you hit your wealth goal.
And the Monte Carlo simulation works really well when there is uncertainty involved.
It’s used a lot in finance, engineering, and even AI. And today we use it when creating your Opes Wealth Plan.
It was first developed during World War II by scientists working on the Manhattan Project. It’s named after the casino hotspot Monte Carlo, in Monaco.
Why? Because roulette wheels and dice rolls also involve probability and uncertainty.
Well, like a roulette wheel spin, no-one knows exactly how much house prices will go up (or down) next year.
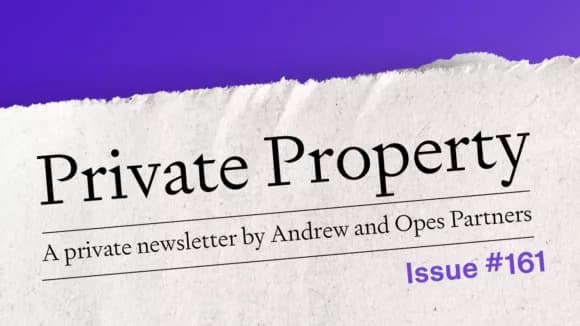
So, when you’re creating a financial plan to say, “On average house prices have gone up by 6-7% a year, so let’s just say they go up by 6%” would give you a tidy upward-sloping straight line on a graph.
But that can make investing feel more certain than it really is.
You might think, “Wow, property’s great. All I have to do is buy this $1 million property, and I’ll have $2 million in 15 years!”
But that’s not how real life works.
Some years the market is up; in other years the market is down.
If you bought at the peak, your return will look very different than if you bought in the trough. So one single line – one single scenario – doesn’t capture the full picture.
Let’s be real … your property isn’t always going to go up in value every single year.
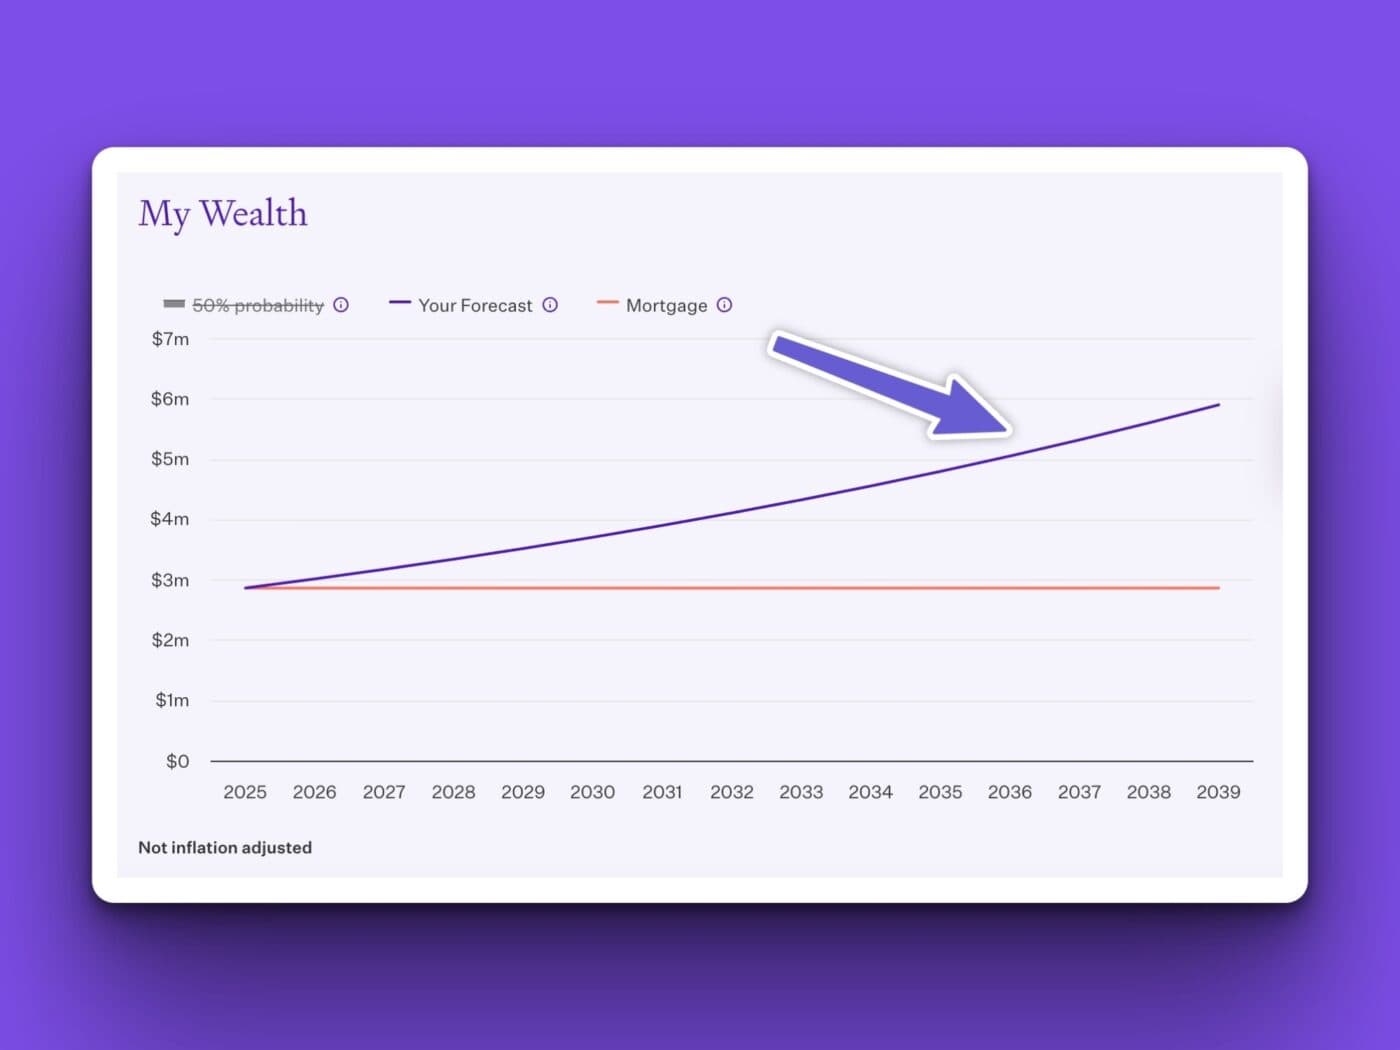
So how do we get that across? We use a fan chart, and you’ll see this within Opes+.
The solid line in the middle is your expected result. So if house prices go up 5% a year, that’s what you’d get. It’s your central scenario.
The shaded area around it? That’s the important part, because that shows where we think your assets value will be 50% of the time.
So your house value (or asset value) won’t always be on the solid line, but we think a good amount of the time you’ll be in the shaded area.
And this shows the uncertainty (the risk) you take when you invest. You know that you’ll likely be better off, but you don’t know exactly how much better you might be ahead.
This is important because we can’t pretend that the future is certain. It’s uncertain, and that’s what we’re trying to show. Because then you can get to grips with the risk you’re taking on.
To build that fan/cone, we use the Monte Carlo simulation.
Here’s what it does (in deliberately simple terms):
That’s how we calculate how wide the fan is, and this gives you a sense of where and how your property value might change.
Now, if your head is spinning, that’s OK. Here’s a video explaining exactly how the Monte Carlo simulation works.
When we create these simulations we can also ask, “How likely is it that you hit your wealth goal?”
And we show you that within your Wealth Plan.
It might be 0%, 5%, 10%, or 50%+. That number represents how many of the 30,000 simulations reached (or exceeded) your goal.
For example, let’s say your goal is to have $2.5 million in assets.
If, in 50% of the simulations, your plan reaches that number (or higher), your plan will show a 50% chance of success.
That means:
This is exactly what you’d expect if you use historic average. For instance, if house prices go up (on average) 7% a year.
Half the time your return will be better than that; half the time your return will be worse than that.
That’s the middle, so if you assume house prices rise 7% a year, even if history repeats there’s only a 50% chance that you get at least that amount of growth. That’s not good or bad, it’s just the math.
Let’s get real for a second. How are you going to feel when you see on your Wealth Plan: “You have a 50% chance of hitting your goal.”
“Only 50%? Yikes that’s bad.”
It’s good that you’re thinking that … because now you’re thinking about risk in a sophisticated way.
If you just drew a straight line, you’re talking a 50/50 chance that you exactly hit your goals … without realising it.
Because what that 50/50 chance is saying is: “If the market performs as it has in the past – you’re on track for your goals.”
That’s not failure; that’s a benchmark. And now you know that you can try to get that percentage up. But if that 50/50 chance still feels too uncertain, think of it as saying:
Suddenly, that 50% doesn’t sound so scary. You’re in the ballpark — or as we say, within cooee of where you want to be.
And investing in your future will generally give you a better chance of hitting your goals than doing nothing at all.
Bear in mind, when you see this “chance of hitting your goal” … it’s not that our strategies at Opes are less certain than other strategies.
All investing has uncertainty.
But we don’t want to hide that uncertainty behind the historical average.
We’d rather show you the risks upfront, so we can work together to manage it.
That said, two main levers you can pull to lift the chances of hitting your financial goal are:
Let’s say you want $1 million of wealth. If you aim for $1.5 million of wealth, you’ll have a really high chance hitting your $1 million goal.
So if you aim high, even if the market doesn’t perform as well, you’ll have a good chance of hitting your goal.
That’s not because your investments are bad – it’s because you haven’t added enough to the plan yet. So add more investments into your plan and that will increase the chance of hitting your goal.
You might ask, “Why can’t I have a 100% chance of hitting my financial goal?”
Wouldn’t that be nice? 100% certainty that your investment journey will be a success. You’ll hit your goal and you’ll never have to worry again.
Here’s why that’s often not a good idea, because there’s always a chance that the market has a few bad years in a row.
So, the only way to achieve 100% success is to invest in assets that never go up or down. That means stuffing money under your mattress.
And while that is technically possible, if you take no risk you get no return and you need to save yourself rich.
If you wanted to save $1 million over 20 years, you’d need to save $961 a week.
If you wanted a 66% chance that you’d hit exactly $1 million or more investing in shares you’d only need to invest $510 a week ($450 less).
Now, if your brain is spinning ... don’t worry. Not everybody needs to understand the mechanics of how it works to get the benefit of the final result.
We are just explaining this to you because there are some Opes investors who are extremely analytical and want to know how it all works.
If you’re not that type of person, all we want you to know is we have actually thought about ALL the possibilities.
We’re thinking about what happens if house prices don’t rise 5% a year. And we’re putting the numbers into your hands so you can make a good investment decision.
So, you don’t need to understand every technical detail, but here’s what we want you to take away:
Yes, this stuff can be nerdy, but it’s also empowering.
Because once you understand the risk, you can manage it — and make smarter, more confident financial decisions.
That’s based on our Monte Carlo modelling. And we want you to know about those possibilities. Not to scare you — but so we can plan around them.

Resident Economist, with a GradDipEcon and over five years at Opes Partners, is a trusted contributor to NZ Property Investor, Informed Investor, Stuff, Business Desk, and OneRoof.
Ed, our Resident Economist, is equipped with a GradDipEcon, a GradCertStratMgmt, BMus, and over five years of experience as Opes Partners' economist. His expertise in economics has led him to contribute articles to reputable publications like NZ Property Investor, Informed Investor, OneRoof, Stuff, and Business Desk. You might have also seen him share his insights on television programs such as The Project and Breakfast.
This article is for your general information. It’s not financial advice. See here for details about our Financial Advice Provider Disclosure. So Opes isn’t telling you what to do with your own money.
We’ve made every effort to make sure the information is accurate. But we occasionally get the odd fact wrong. Make sure you do your own research or talk to a financial adviser before making any investment decisions.
You might like to use us or another financial adviser