Property Market
Auckland house prices | How is the Auckland property market going?
Gain insights into Auckland's property market with updated statistics on house prices, rental trends, and investment opportunities.
Property Market
5 min read

Author: Ed McKnight
Resident Economist, with a GradDipEcon and over five years at Opes Partners, is a trusted contributor to NZ Property Investor, Informed Investor, Stuff, Business Desk, and OneRoof.
Reviewed by: Laine Moger
Journalist and Property Educator, holds a Bachelor of Communication (Honours) from Massey University.
The median property investment yield in Auckland is 4%. That compares to a median yield in New Zealand of 4.5%
We’re answering this question because property investors always ask: “What’s a good yield in today’s market?”
In other words, what sort of rental return should property investors expect?
When you see it asked online, most people respond: “Well, it depends.”
It depends on your strategy; it depends on where and what you buy.
It’s not a straightforward answer, but as a property investor you still want an answer.
Here at Opes Partners we want investors to be as informed as possible. I ran the numbers on all 12,958 Trade Me rental listings to find out what investors are accepting right now.
That way you can make an informed decision with your investment properties.
In this article, you’ll learn what a good rental yield looks like in Auckland.
A good rental yield in Auckland depends on the type of property you’re buying, but in today’s market most investors are accepting around 4%.
Here at Opes Partners we aim for a 4-4.6% gross yield for Auckland growth properties (houses and townhouses).
We then aim for a 5.5-6.3% gross yield for (dual-key apartment) yield properties. These sort of properties earn a higher rental yield but don’t go up in value as fast.
Remember, your gross yield is calculated as:
( Weekly rent x 52 ) / (current value).
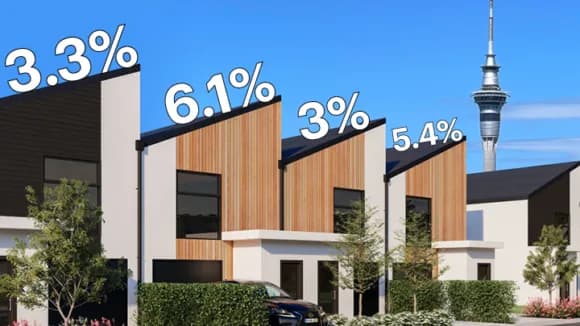
The median yield investors are willing to accept in Auckland is 4%, which is 0.5% lower than the country’s median.
As you can see in the above graph, Auckland properties have lower yields than properties in the rest of the country.
But some properties fetch a lower yield. The bottom 25% of properties have a gross yield of under 3.2%.
On the other hand, the top 25% of Auckland properties have a gross yield above 4.6%.
If you get a 4.6%+ gross yield in Auckland you should be happy. You’re in the top 25%.
But, of course, it also depends on the property type.
While a gross yield of 4.5% is good for a growth property, like a townhouse, a 4.5% gross yield for a yield property would be pretty poor.
To get the estimated yield property investors are willing to accept, we gather data from Trade Me and OneRoof.
The Trade Me listings show how much rent investors are currently advertising. We then match that rental information with OneRoof data to see how much those properties are worth.
This shows us the gross yield property investors are actually willing to accept. We then did this for every property on Trade Me.
For instance, here is a property available for rent at the time we completed the analysis:
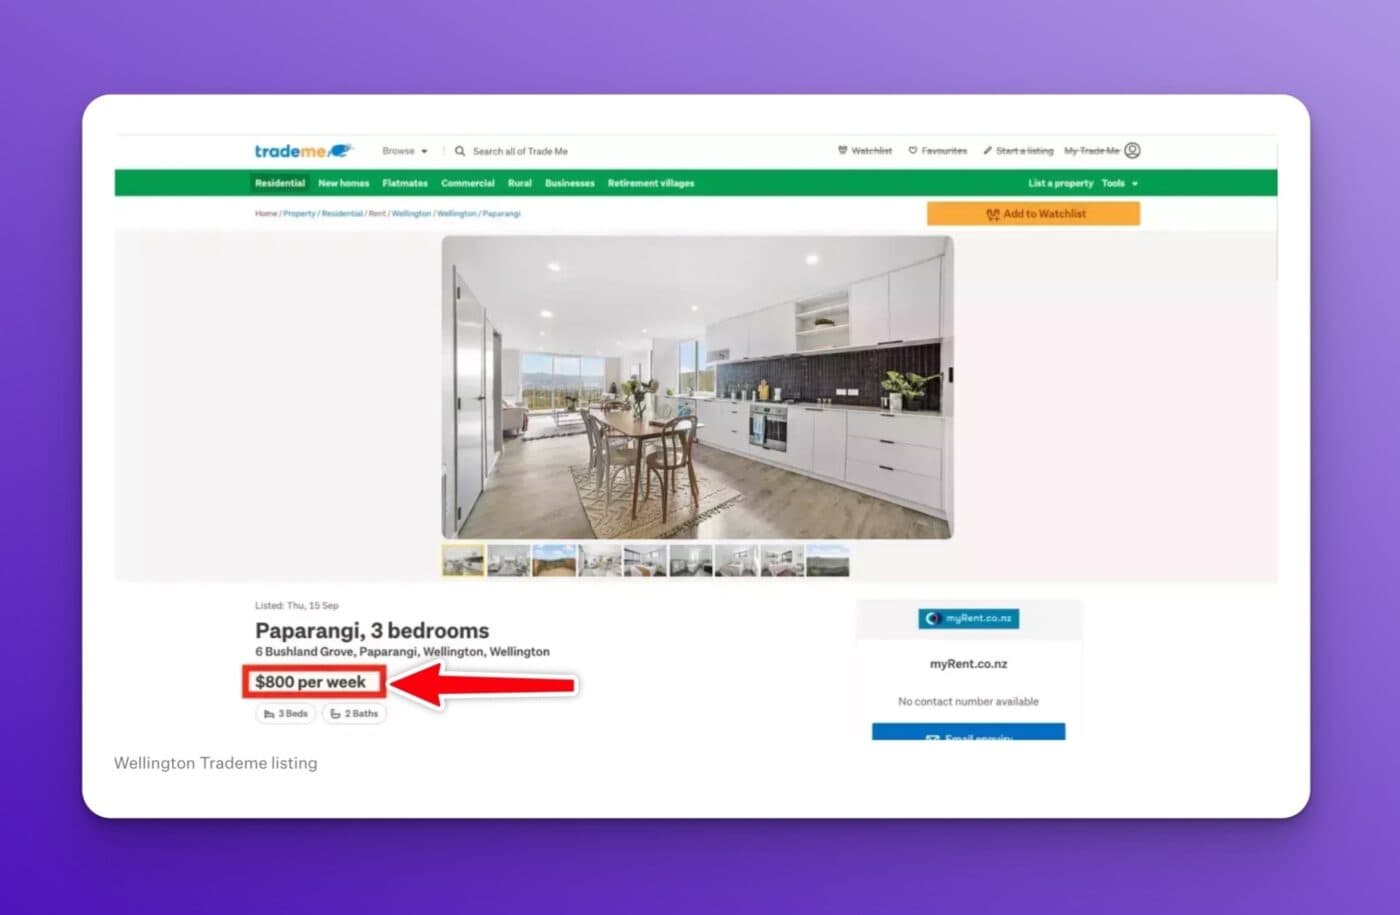
It’s a 3-bed New Build townhouse in Wellington, and it’s available to rent for $800 a week.
Then, we cross-referenced this with OneRoof’s estimated valuation.
And in this instance this property is estimated to be worth $920,000, giving it a gross yield of 4.52% … bang on average for the country.
We then use a computer to do this over 10,000 times, and after cleaning up the data we’ve now got figures no-one else has.
If you follow a lot of property investors on social media you might think: “Why are these numbers so low? The numbers some investors talk about online are higher.”
Some investors calculate their gross yield using the price they paid 10 years ago, not what that property is worth today.
When you calculate the gross yield you should always use the value of the property today.
What you spent isn’t relevant. What matters is the yield you are getting based on what the asset is worth today. That’s because if your house has increased in value you could always sell your property and do something else with the money.
Over the long term Auckland rental yields have been steadily declining.
In the early 1990s gross yields were around 6.6%; now they’re closer to 3.4%.
That’s because property prices have increased by more than 7% per year over the long run, while rents have grown at a slower 4-5% per year. When prices rise faster than rents, yields fall.
This is important. Sometimes property investors read investment books that are decades old. The specific yields mentioned in a 30-year-old book won’t be relevant today.
What was a realistic yield 5 years ago may be unachievable in today’s market.
These numbers are different from the ones mentioned above because they’re calculated using different data. This graph uses the median rent and median sale price of a property. This gives an estimated yield, whereas the other data on this page is based on actual yields investors are willing to accept.
This data isn’t here to give you a yes-or-no answer about whether to buy a specific property or not. It’s here to help you ask better questions.
Property is a direct form of investment. You’re not buying a whole city or region … you’re buying one specific property. And that property’s rental return will depend on its price, rent, condition and tenant demand.
So when you’re using gross yield to assess opportunities compare the yield to that region’s range, not a national rule of thumb.
Use gross yield to screen deals, not approve them, then move on to net yield and cashflow for a fuller picture.
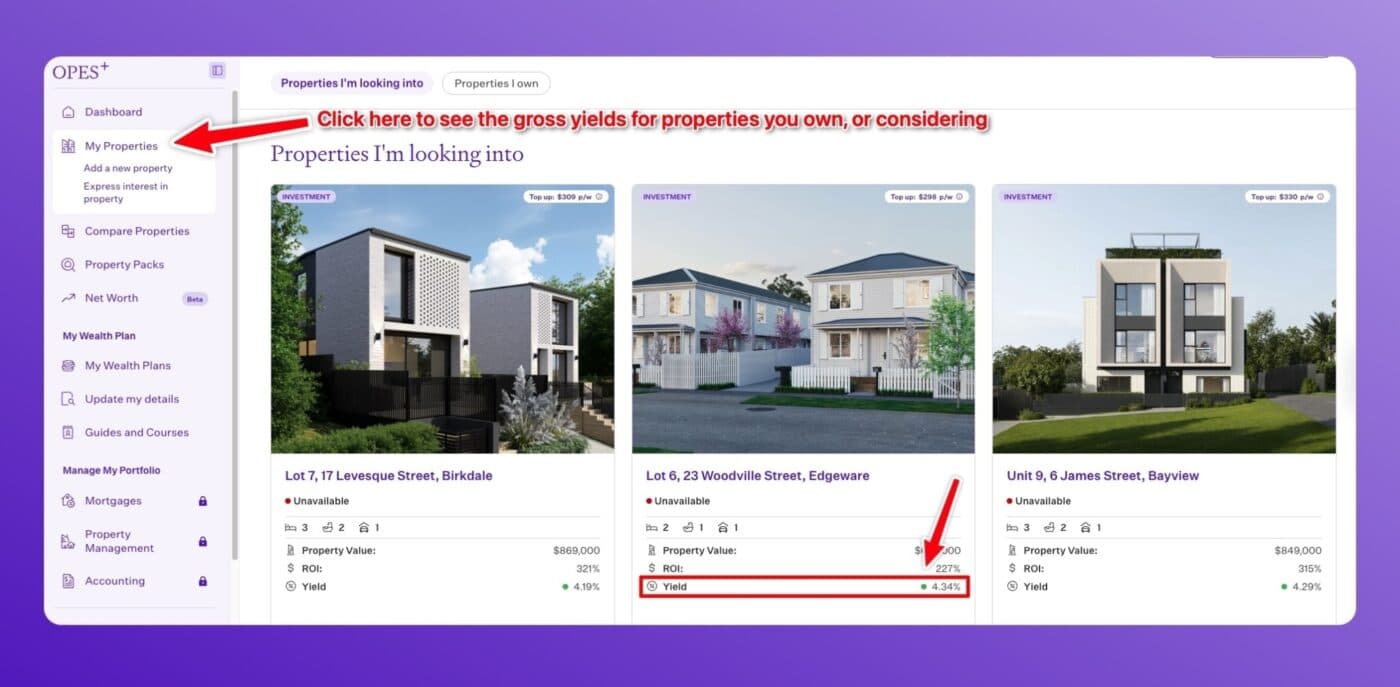
If you’re signed up with Opes+ you can track gross yield directly on the platform. Just head to My Properties to see the gross yield for properties you own, or ones you’re considering.
Free calculator
Plug in the price and weekly rent and find out the gross yield - so you can see how it stacks up against what Auckland investors are actually accepting.
Find out nowResident Economist, with a GradDipEcon and over five years at Opes Partners, is a trusted contributor to NZ Property Investor, Informed Investor, Stuff, Business Desk, and OneRoof.
Ed, our Resident Economist, is equipped with a GradDipEcon, a GradCertStratMgmt, BMus, and over five years of experience as Opes Partners' economist. His expertise in economics has led him to contribute articles to reputable publications like NZ Property Investor, Informed Investor, OneRoof, Stuff, and Business Desk. You might have also seen him share his insights on television programs such as The Project and Breakfast.
This article is for your general information. It’s not financial advice. See here for details about our Financial Advice Provider Disclosure. So Opes isn’t telling you what to do with your own money.
We’ve made every effort to make sure the information is accurate. But we occasionally get the odd fact wrong. Make sure you do your own research or talk to a financial adviser before making any investment decisions.
You might like to use us or another financial adviser